ITP Data Analytics: Data Grid Analysis - Peer Comparison Report
The data grid displays the results of your filter selections in a table. Metric names appear as column headers, and
You can click Manage Filters to open the Filters window and see the original filter selections used to create the data grid. The filters pre-populate to the original selections when you open the window. If you modify any filters and click Apply, ITP Data Analytics initiates a new report as a new view. Before initiating a new report, click Select Counterparties to re-confirm your counterparty selections if applicable.
Visit Export Results from ITP Data Analytics to learn how to download the results as an Excel or CSV file.
Click the icons to expand, collapse, and print the content on this page.
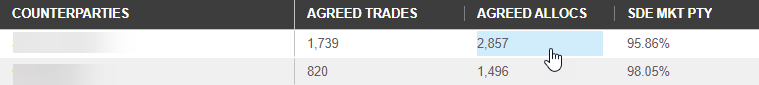
- Header: User's total number of counterparties in the analysis
- Columns: Metric names available in the Peer Comparison Report.
Visit ITP Data Analytics: CTM® Metrics for the definition of each metric.
- Rows: You and your anonymous peers.
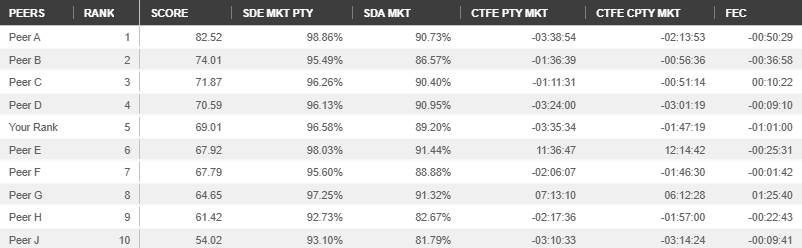
By default, the report sorts the data by the highest volume client in descending order for the selected date range.
If you sort the data by a different metric, the data grid displays an arrow next to the metric name. ALL always remains on top.
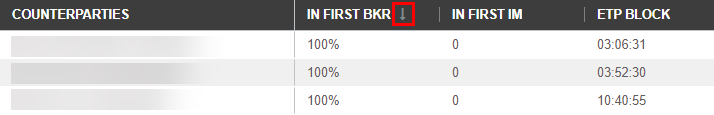
To Sort by a Different Metric
- Click the column header of a metric once to sort the column in ascending order, signified by the up arrow.
- Click again to sort the column in descending order, signified by the down arrow.
- Click again to return to the default sorting method.
Put your cursor in a column header and click ![]() to access the following functionality:
to access the following functionality:
- Pin Column: Pin a column to one side when scrolling through the data grid. You can Pin Left or Pin Right. No Pin unpins the column.
- Size Columns: Adjust the size of a column in data grid. You can Autosize This Column, Autosize All Columns, or Reset Columns.
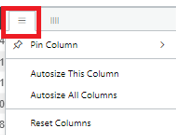
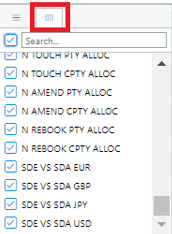
- Metric Filter: Filter which metrics appear in the data grid. The default view shows all metrics available in the report.
Additional metrics are available for each displayed counterparty.
To View Additional Metrics
- Click a cell in the data grid to expand additional data related to that counterparty.
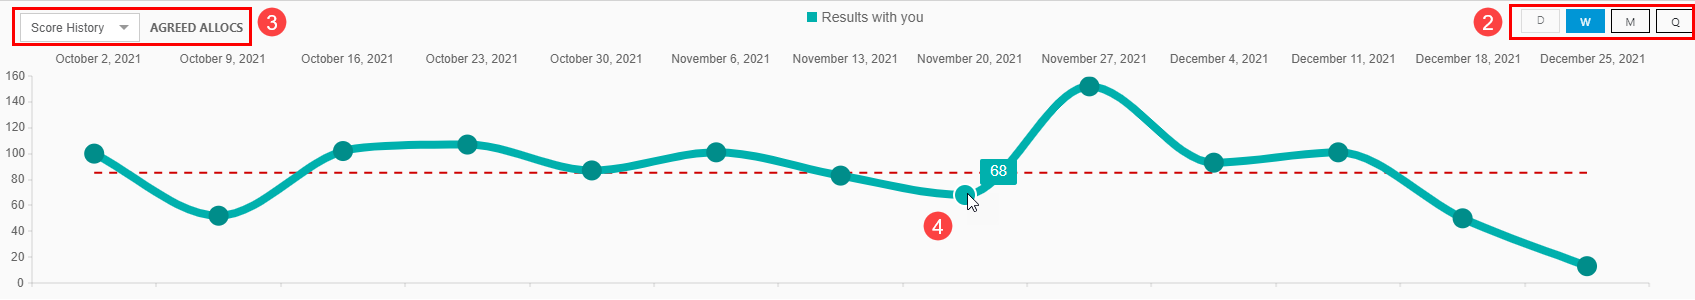
- Use the date toggle to view metrics for a smaller report period than the one in the main data grid
ex: If the report uses the monthly report period, you can click W but not Q.
- D: Daily
- W: Weekly
- M: Monthly
Q: Quarterly
- Select a view from the drop-down list.
- Score Peer (default): This view shows how your metric compares to
- Rank Peer: This view shows
- Score History: This view shows how your performance changed over time with that counterparty in a line graph.
- Rank History: This view shows your
- Score Peer (default): This view shows how your metric compares to
- Place your cursor over a data point to view the metric for that period.
The maximum score is 100, and the minimum score is 0. ITP Data Analytics calculates the scores of you and your peers using the below steps:
- An anonymous peer group of you and seven to nine others are selected based on your filters and the below criteria:
- Region
- Similar volume
- Similar cross border trading diversity
- Your weighted results for six different metrics are calculated using the formula
((Spread - (Highest Value - Subscriber Value))/Spread) * Metric Weight.Spread: Difference between the highest and lowest value
Table 1 Metric Weights for Brokers Brokers Metric Name Equity Debt CTFE PTY MKT 15 10 MTA BLOCK 15 20 SDE MKT PTY 20 20 SDA MKT 15 15 TOUCH PTY BLOCK 20 20 CORR PTY BLOCKS 15 15 - Your weighted results are added together to produce your overall Score.