GTR CFTC/Canada/SEC: Portal Home Page
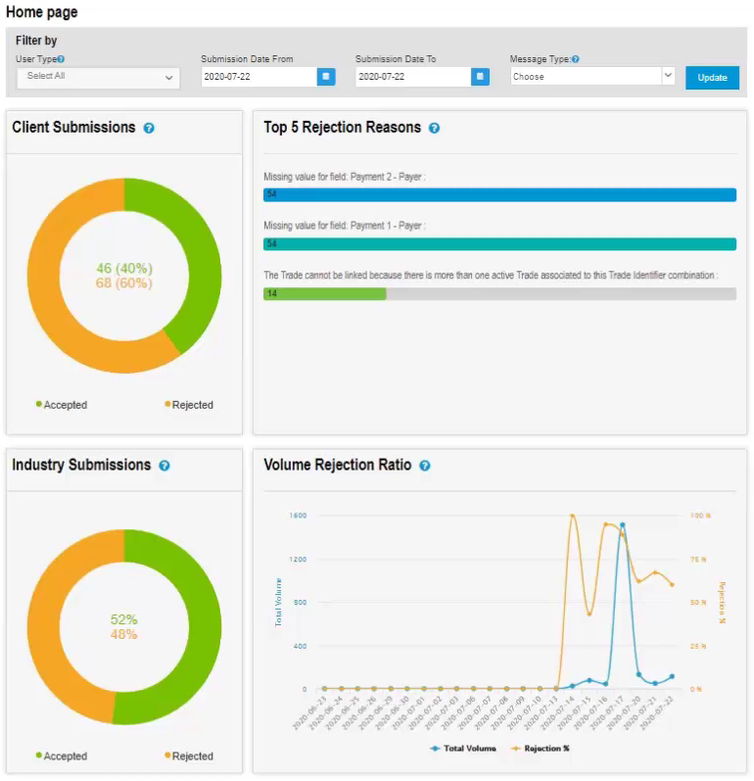
The Home Page displays a series of infographics summarizing the submission data within the Trade Repository relevant to your login ID. The infographics are interactive and allow you to drill-down to view the underlying data. You can also view Industry Submission statistics as a reference.
Click the icons to expand, collapse, and print the visible/expanded content on this page.
|
The top-level filter bar allows you to choose the type of data shown. You must click Update to apply and view any changes to the data.

|
User Type: The User Type dropdown updates the data as follows:
- Trade Party: Update the graphics to view submissions where you are listed as the trade party on the submitted data.
- Submitter: Update the graphics to view submissions where you are listed as the data submitter in the submitted data.
- Execution Agent: Update the graphics to view submissions where you are listed as an execution agent on the submitted data.
- Select All (Default value): Update the graphics to view submissions where you are listed as the data submitter, trade party, or execution agent. Duplicates are counted once if you are listed in multiple party fields.
Date Range: The is set to the previous reporting date by default. Using the date range option, allows you to access a 30-day date range within a 1-year period. The data is an aggregate for the date range selected if you choose multiple dates.
Message Type: The dropdown options are Trade State /PPD or Valuation to better reflect your submission. Multiple selections are allowed, and both are selected by default.
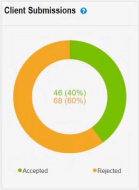
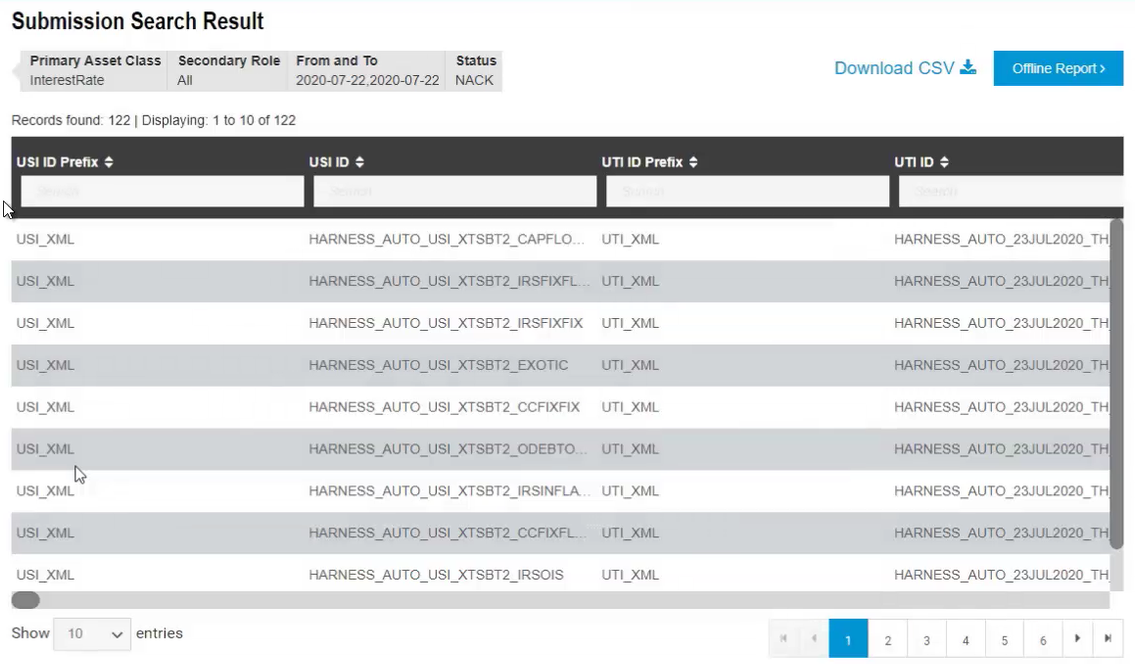
The Client Submissions infographic provides a graphical summary of your previous day’s acceptance and rejection rate with the submission volumes displayed in the center. You can drill-down into the graphic to view the underlying data for both accepted and rejected submissions from the submission search results screen.
|
Note |
|
| Note |
| The underlying data for rejected trades generally displays a higher figure then what is displayed on the pie graph. The pie graph displays unique submissions whereas the underlying data is segregated by rejection reasons. You can utilize the Message ID field to understand unique submissions and reconcile the underlying data to the figure in the pie graph. |
|
Results Page
|
Industry Statistics provides you an aggregated view of submission performance for all GTR clients who submit to the same jurisdiction and asset class. This infographic is not interactive.
Volume Rejection Ratio gives you a visual trend over the last 30 days of your volume and rejection ratio. Mouse over any of the plot points to view the actual volume and rejection percentage.
The Top Five Rejected Reasons list is an aggregated summary highlighting your most frequent rejection reasons. Single submissions that are rejected for multiple reasons are included in the count for each of those reasons. Clicking on any of the bars drills-down into the underlying data by taking you to the submission search results screen.